Trading Economics – In today’s fast-paced financial world, having access to accurate and up-to-date economic data is essential for investors, analysts, researchers, and policymakers. Trading Economics is one of the most reliable platforms offering a wealth of global economic indicators, financial markets data, and forecasts—all in one place.
This article explores what Trading Economics is, its main features, and how professionals use it to make informed decisions in an ever-changing global economy.
What Is Trading Economics?
Trading Economics is a globally recognized data platform that provides real-time economic and financial data for over 200 countries. It includes more than 20 million indicators sourced from official government and institutional databases.
Whether you’re looking to monitor inflation in the Eurozone, track interest rate changes in the United States, or compare GDP growth in emerging markets, Trading Economics has you covered.
Key Features of Trading Economics
1. Comprehensive Economic Indicators
The platform tracks a wide range of macroeconomic data, including:
-
GDP (Gross Domestic Product)
-
Unemployment rates
-
Inflation and CPI (Consumer Price Index)
-
Interest rates and monetary policy
-
Government debt and fiscal balances
-
Trade balances and current accounts
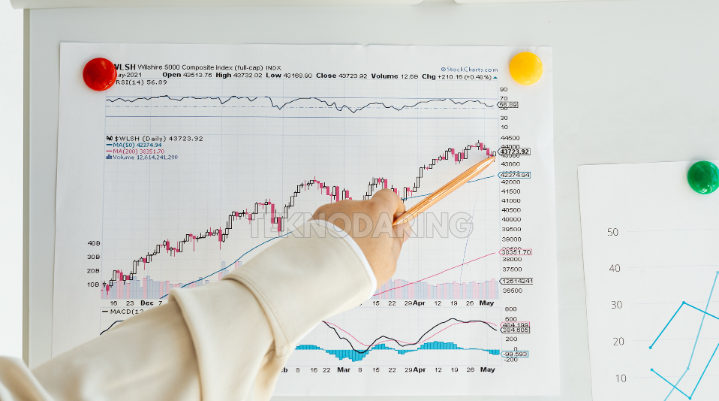
Each indicator includes historical data, real-time updates, charts, and often expert forecasts based on economic modeling.
2. Global Market Data
In addition to macroeconomic figures, Trading Economics also offers real-time financial market data, such as:
-
Stock market indexes
-
Government bond yields
-
Commodity prices (gold, oil, etc.)
-
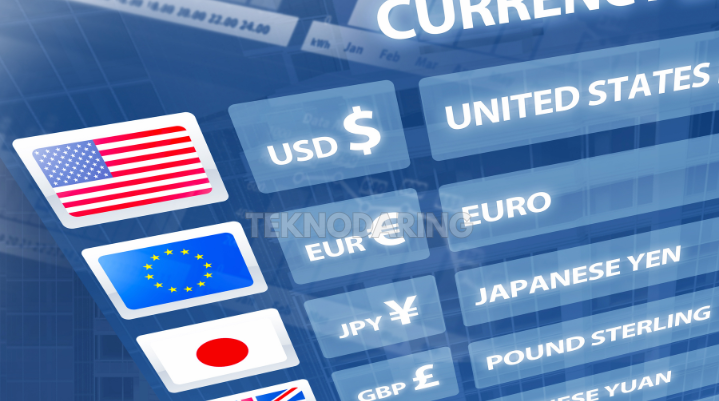
Exchange rates
-
Interest rate benchmarks
This makes the platform especially useful for traders and investors tracking how global economic shifts affect asset prices.
3. Forecasting Tools
One standout feature is the platform’s economic forecasting models. Trading Economics uses proprietary models and algorithms to forecast data points like GDP growth, inflation, interest rates, and more. This allows users to anticipate economic changes and plan strategies accordingly.
4. Custom Dashboards and Data Exports
Users can customize dashboards, download data in Excel or CSV format, and integrate the API for automated data retrieval. This is a powerful feature for businesses or analysts managing large-scale research projects or building data-driven tools.
Who Uses Trading Economics?
For Financial Analysts
Analysts rely on Trading Economics to understand economic trends that can impact markets, industries, and investment decisions.
For Businesses and Corporations
Companies use the platform for risk management, market entry analysis, and strategic planning based on economic conditions in various countries.
For Government and Policy Makers
Economists and government agencies use it to benchmark their economies, assess fiscal policies, and understand global trends.
Trading Economics vs Other Data Platforms
While there are many sources of economic data, Trading Economics stands out for:
-
User-friendly interface
-
Wide range of up-to-date indicators
-
Reliable sources from official institutions
-
Free and premium tiers for different user needs
Compared to more complex or expensive platforms like Bloomberg or Reuters, Trading Economics provides a cost-effective and easy-to-navigate alternative.
Final Thoughts: Why Trading Economics Is a Must-Have Tool
In an increasingly interconnected world, understanding the economic forces behind market movements is essential. Trading Economics offers a comprehensive solution for anyone who needs real-time access to trusted global economic data and market information.
Whether you’re an investor, academic, policymaker, or entrepreneur, Trading Economics equips you with the tools to stay ahead of economic trends and make smarter decisions based on facts—not guesswork.

