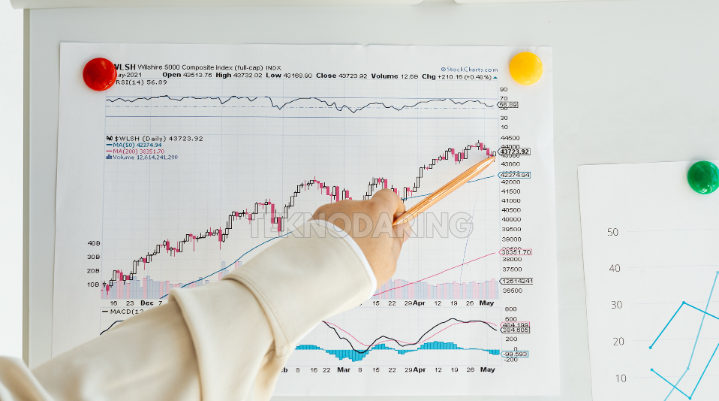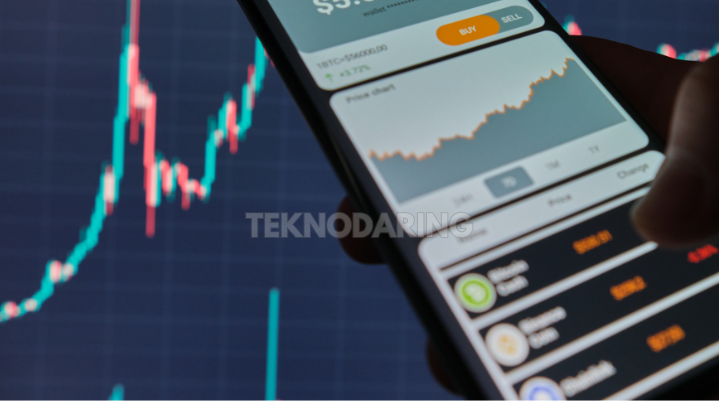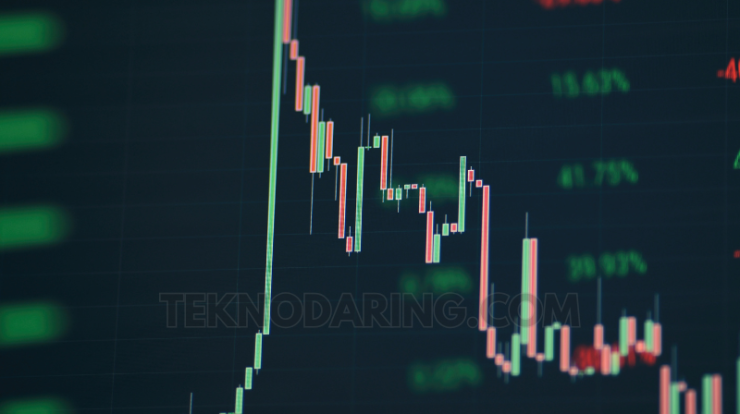
Price action trading is a popular strategy used by traders who prefer a clean chart and rely purely on the movement of price over time. Instead of depending on technical indicators or complex formulas, price action traders interpret market behavior based on raw price data. This method is used in forex, stocks, commodities, and crypto markets, making it a universal approach for all types of traders.
What is Price Action Trading?
Price action trading is a technique that involves making trading decisions based solely on price movement. Traders analyze patterns, support and resistance levels, candlestick formations, and market structure without relying heavily on indicators like RSI or MACD.
In simple terms, price action is how price moves—and learning to read it is like learning a new language that the market speaks.
How It Works
Rather than predicting where the market will go next, price action traders react to what the market is doing right now. They look at:
-
Candlestick patterns
-
Trend direction
-
Support and resistance zones
-
Breakouts and fakeouts
-
Market structure (higher highs, lower lows)
This strategy works best on clean charts with minimal clutter, allowing traders to focus on price behavior.
Why Use Price Action?
1. Simplicity
Price action trading simplifies the chart, helping traders focus only on what matters—the price. No lagging indicators or overcomplicated setups.
2. Versatility
It can be used across all markets and timeframes, from 1-minute charts to daily and weekly setups. Whether you’re a scalper or swing trader, price action fits any style.
3. Real-Time Clarity
Because it’s based on real-time market data, price action offers a more immediate look at market sentiment, helping traders make faster decisions.
Key Concepts in Price Action Trading
Candlestick Patterns
These visual representations of price help identify momentum and reversal signals. Some popular patterns include:
-
Pin Bar: A long wick and small body, showing rejection of a price level.
-
Engulfing Candle: A larger candle completely covers the previous one, signaling a shift in momentum.
-
Doji: Signals indecision, often seen before a breakout or reversal.
Support and Resistance
These are horizontal levels where price has historically reversed or paused. They serve as decision zones where traders look for entry or exit points.
Market Structure
Understanding how price makes higher highs and higher lows (uptrend), or lower highs and lower lows (downtrend), helps traders align their positions with the market’s direction.
Pros and Cons of Price Action Trading
Pros:
-
No reliance on lagging indicators
-
Works in any market or timeframe
-
Clear and straightforward approach
-
Enhances reading of market psychology
Cons:
-
Requires strong pattern recognition skills
-
Subjective—different traders may see different setups
-
Takes time and practice to master
How to Get Started with Price Action
Step 1: Learn Basic Patterns
Start by studying common candlestick formations and how they behave in different market conditions.
Step 2: Use a Clean Chart
Remove all unnecessary indicators and focus on price. Draw key support and resistance levels manually.
Step 3: Practice on Demo Accounts
Before trading real money, test your strategies on a demo account. Watch how price behaves at key zones and observe how patterns play out over time.
Final Thoughts
Price action trading offers a powerful, no-frills approach to the market. It puts the focus back on what truly drives movement: price itself. While it takes time to master, this strategy can give traders a solid edge by helping them understand market psychology, improve timing, and reduce dependency on lagging tools.
If you’re looking for a cleaner, smarter way to trade, learning price action might just be your next best move.

